Greenland Ice Summary. 21 October 2019
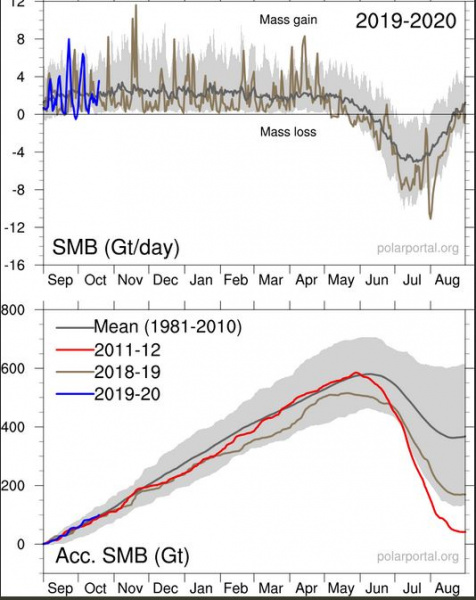
2018-2019 by contrast was a slightly negative Surface Mass Balance year. A dry, cold winter didn't allow much ice to build up. A stationary high pressure system then sat over Greenland for much of the June-August summer with high melting. The upper graph (SMB Gt/day = Surface Mass Balance Gigatons/day) shows the big melting spike in late July which was hammered by news as conclusive proof of "climate change". A week of melting doesn't indicate what happened during the other 51 weeks of the year and media are caught once again cherrypicking scientific data to match their political masters outlook. The blue line is for the 2019-2020 season which is now underway. Ice buildup looks normal in 2019-2020 with a couple of big spikes indicating storms and snowfall. The first mid September spike on the graph is snowfall from the remnants of Hurricane Dorian. Dorian churned up the Northern Bahamas with many lost lives before following the USA coastline and then dumping snow as it passed just south of Greenland. Solar activity is at its lowest level in a century and that means just one thing....cold. The sun is the main driver of weather, quakes and eruptions. Politicians, Swedish schoolkids, Al Gore, car exhausts, forest fires have no effect on weather. Data courtesy Danish Meteorological Institute. Aotearoa Earthquake and Volcano Forecast Service © 2013 - 2026 |